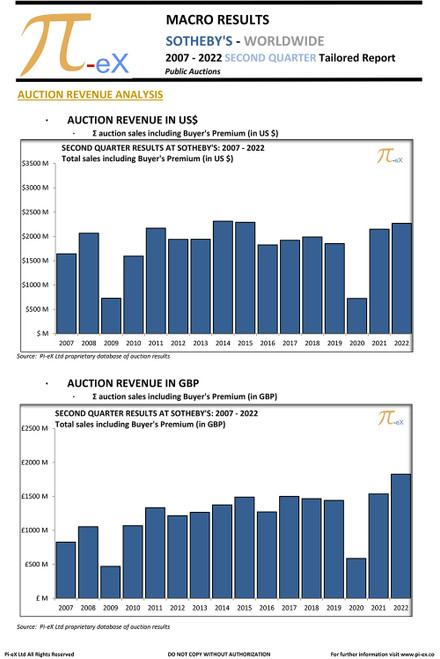
This MACRO Tailored Report illustrates the combined worldwide auction results in the second quarter of the calendar year over the last sixteen years (2007 to 2022) at SOTHEBY’S.
The 6 page report includes charts displaying:
- Total auction revenue (in US$ and GBP)
- Number of auctions held
- Average revenue generated per auction (in US$ and GBP)
- Breakdown of the number of auctions classified by revenue range (less than US$10m, between US$10m and US$100m, more than US$100m)
- Breakdown of the value of auctions classified by revenue range (less than US$10m, between US$10m and US$100m, more than US$100m)
- Number of lots catalogued
- Number of lots withdrawn
- Number of lots auctioned
- Number of lots sold
- Number of lots bought-in (unsold)
- Sell through rate (in %)
- Average revenue per lot sold (in US$ and GBP)
- Breakdown of the number of auctions classified by lot volume (less than 100 lots, between 100 and 200 lots, more than 200 lots)
- Breakdown of the value of auctions (in US$) classified by lot volume (less than 100 lots, between 100 and 200 lots, more than 200 lots)
The report's addendum contains further information about Pi-eX’s MACRO Report's Methodology as well as a detailed listing of all auctions excluded for the purpose of the overall analysis.


